Flutter - Trippo Ride Sharing App (Uber Clone) - Driver’s Earnings and Ratings [Part-20]
عدد الدروس : 1 عدد ساعات الدورة : 00:35:35 شهادة معتمدة : نعم التسجيل في الدورة للحصول على شهادةللحصول على شهادة
- 1- التسجيل
- 2- مشاهدة الكورس كاملا
- 3- متابعة نسبة اكتمال الكورس تدريجيا
- 4- بعد الانتهاء تظهر الشهادة في الملف الشخصي الخاص بك
قائمة الدروس
عن الدورة
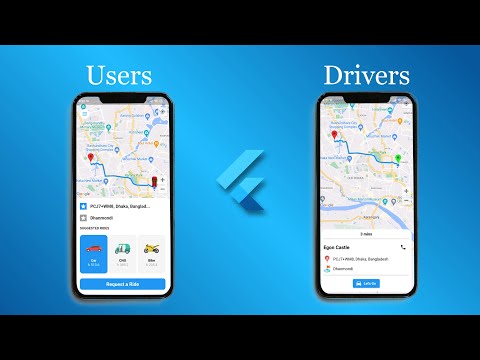
In this twentieth part of the Trippo Ride Sharing App series, you will build the driver earnings and ratings dashboard, which is an important feature for managing driver performance in a ride-sharing system.
You will start by fetching completed trip data from Firebase Firestore, where all ride records are stored. Using this data, you will calculate total earnings based on completed trips, fares, and ride history.
Next, you will design a driver dashboard screen that displays key statistics such as total earnings, number of completed trips, and average rating. This gives drivers a clear overview of their performance inside the app.
You will also implement a rating display system that shows feedback received from users. This includes calculating the average rating and presenting it in a clean and visually appealing format.
Additionally, you will structure the UI to make the dashboard easy to read and responsive, ensuring it works well on different screen sizes.
State management will be used to keep the dashboard data updated in real time, so any new completed trip or rating update is immediately reflected.
By the end of this part, your Flutter ride-sharing app will include a complete driver analytics system, allowing drivers to track their earnings and perfo


