Master Interactive Excel Dashboards: Build the Perfect Excel Dashboard
عدد الدروس : 1 عدد ساعات الدورة : 00:54:08 شهادة معتمدة : نعم التسجيل في الدورة للحصول على شهادةللحصول على شهادة
- 1- التسجيل
- 2- مشاهدة الكورس كاملا
- 3- متابعة نسبة اكتمال الكورس تدريجيا
- 4- بعد الانتهاء تظهر الشهادة في الملف الشخصي الخاص بك
قائمة الدروس
عن الدورة
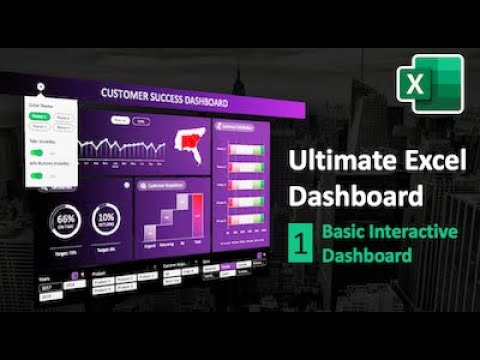
This course provides a complete guide to creating stunning and interactive Excel dashboards for professionals, managers, and data enthusiasts. You will start by understanding the fundamentals of Excel tables, PivotTables, PivotCharts, and slicers, which form the backbone of dynamic dashboards. Step-by-step tutorials demonstrate how to import and structure data efficiently, clean it, and use formulas to automate calculations. You’ll also learn best practices for designing visuals that communicate insights clearly, including conditional formatting, charts, and dynamic indicators. Advanced tips cover interactive elements like dropdowns, checkboxes, and linked charts to allow real-time data analysis. By the end of the course, you will be able to build a full Excel dashboard capable of tracking KPIs, sales performance, financial metrics, or project progress. This course is suitable for beginners who want a solid foundation as well as intermediate users looking to enhance their Excel visualization skills. Whether you’re creating dashboards for business, finance, or personal projects, this course equips you with the skills to present data professionally and efficiently.Interactive Excel Dashboard Tutorial | Build Perfect Dashboards


