Interactive Excel Dashboard Step-by-Step Tutorial for Beginners
عدد الدروس : 1 عدد ساعات الدورة : 01:14:48 شهادة معتمدة : نعم التسجيل في الدورة للحصول على شهادةللحصول على شهادة
- 1- التسجيل
- 2- مشاهدة الكورس كاملا
- 3- متابعة نسبة اكتمال الكورس تدريجيا
- 4- بعد الانتهاء تظهر الشهادة في الملف الشخصي الخاص بك
عن الدورة
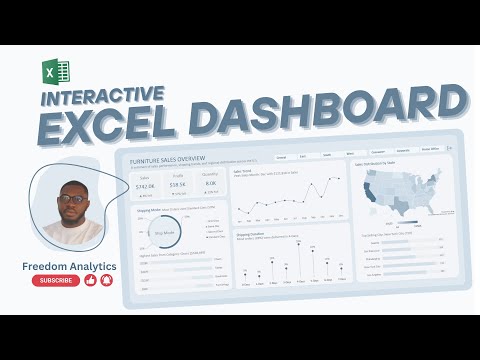
This beginner-friendly course guides you step-by-step in creating an interactive Excel dashboard from scratch. You’ll start by organizing your data efficiently, learning how to set up tables, and preparing your dataset for analysis. The tutorial covers essential Excel tools, including PivotTables, PivotCharts, slicers, and dynamic charts, to make your dashboard both functional and visually engaging.
You’ll also explore techniques for adding interactivity, such as dropdown menus, checkboxes, and dynamic ranges, allowing you to filter and update your data with a single click. Conditional formatting is explained to highlight trends, outliers, and key performance indicators (KPIs), making your dashboard insightful and actionable.
By the end of this tutorial, you’ll have a professional-looking dashboard that’s easy to update and customize for any type of data. This course equips you with the skills to transform raw Excel data into a powerful visual tool, ideal for business, finance, pro


