Dynamic & Interactive Excel Dashboards: Pivot Tables, Charts & Visual Analytics
عدد الدروس : 44 عدد ساعات الدورة : 18:09:44 شهادة معتمدة : نعم التسجيل في الدورة للحصول على شهادةللحصول على شهادة
- 1- التسجيل
- 2- مشاهدة الكورس كاملا
- 3- متابعة نسبة اكتمال الكورس تدريجيا
- 4- بعد الانتهاء تظهر الشهادة في الملف الشخصي الخاص بك
قائمة الدروس
عن الدورة
This course offers a comprehensive guide to creating dynamic and interactive dashboards in Microsoft Excel. You’ll learn to leverage pivot tables, charts, and advanced formatting techniques to create dashboards that update automatically based on your data inputs.
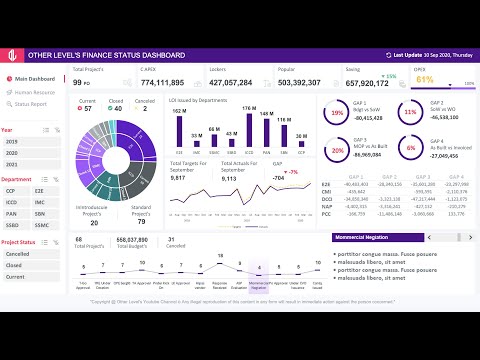
The course covers practical examples such as financial statistics, school dashboards with dynamically changing student photos, sales analytics, and personal finance trackers. Step-by-step tutorials show you how to combine multiple Excel features to make dashboards visually engaging and interactive, enabling quick insights for decision-making.
Learn to design dashboards that not only summarize data efficiently but also allow end-users to filter, sort, and interact with reports in real-time. Advanced techniques like dynamic image linking, conditional formatting, and creative charting are included to take your dashboards to the next level.
By the end of this course, you’ll be equipped to build professional Excel dashboards for business, education, or personal use. The skills learned will enhance your reporting capabilities, i


