Single Dynamic Excel Dashboard: Master Pivot Tables, Slicers & Charts
عدد الدروس : 81 عدد ساعات الدورة : 23:11:50 شهادة معتمدة : نعم التسجيل في الدورة للحصول على شهادةللحصول على شهادة
- 1- التسجيل
- 2- مشاهدة الكورس كاملا
- 3- متابعة نسبة اكتمال الكورس تدريجيا
- 4- بعد الانتهاء تظهر الشهادة في الملف الشخصي الخاص بك
قائمة الدروس
عن الدورة
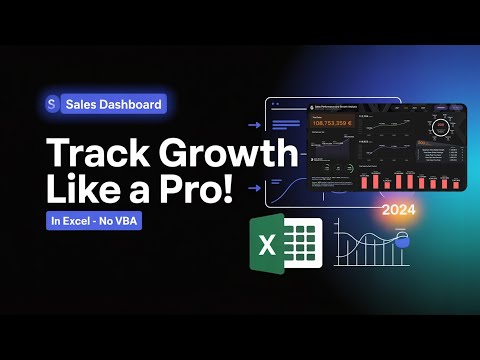
This course teaches you how to build single dynamic dashboards in Microsoft Excel that are powerful, interactive, and easy to update. Designed for analysts, managers, and Excel enthusiasts, it covers real-world examples such as sales performance, profit and loss analysis, shipment analytics, project tracking, and personal finance management.
Starting with pivot tables, you’ll learn how to summarize large datasets efficiently. Slicers are introduced to allow dynamic filtering, giving you the ability to create dashboards that respond to user selections instantly. The course demonstrates how to combine pivot tables with charts, conditional formatting, and creative visual elements to design dashboards that are both visually appealing and highly functional.
Advanced templates are also covered, including project status dashboards and call center performance tracking. You’ll gain practical skills to streamline reporting, improve data visibility, and make informed decisions.
By the end of this course, you will be able to design and maintain interactive Excel dashboards capable of handling multiple scenarios, all within a single dynamic file. Whether for business, personal finance, or project management, these dashboards will enhance your


