Microsoft Excel Dashboard Masterclass: From Beginner to Advanced with AI Insights
عدد الدروس : 14 عدد ساعات الدورة : 23:48:22 شهادة معتمدة : نعم التسجيل في الدورة للحصول على شهادةللحصول على شهادة
- 1- التسجيل
- 2- مشاهدة الكورس كاملا
- 3- متابعة نسبة اكتمال الكورس تدريجيا
- 4- بعد الانتهاء تظهر الشهادة في الملف الشخصي الخاص بك
قائمة الدروس
عن الدورة
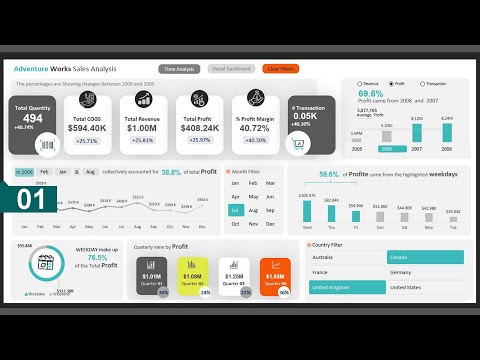
This comprehensive Excel Dashboard Masterclass is designed to take you from beginner to advanced levels in building professional, interactive dashboards. Across multiple lessons, you’ll learn to manage data, create charts, and design dashboards that convey insights effectively.
The course starts with fundamental techniques for organizing and analyzing data, followed by step-by-step guidance on creating dynamic dashboards. You’ll explore advanced visualization methods, combining charts, tables, and conditional formatting for impactful presentations.
Special focus is given to leveraging AI tools like ChartGPT to automate data analysis and generate insights quickly. Lessons cover best practices for interactivity, such as filters, slicers, and clickable elements that enhance user experience.
Students will also learn techniques for integrating multiple data sources, managing large datasets, and designing dashboards suitable for executive reporting. Real-world examples demonstrate how to turn complex data into actionable insights, making this course valuable for professionals, analysts, and anyone looking to elevate their Excel skills.


