How to Read Candlestick Charts (Beginner to Pro)
عدد الدروس : 1 عدد ساعات الدورة : 00:55:18 شهادة معتمدة : نعم التسجيل في الدورة للحصول على شهادةللحصول على شهادة
- 1- التسجيل
- 2- مشاهدة الكورس كاملا
- 3- متابعة نسبة اكتمال الكورس تدريجيا
- 4- بعد الانتهاء تظهر الشهادة في الملف الشخصي الخاص بك
عن الدورة
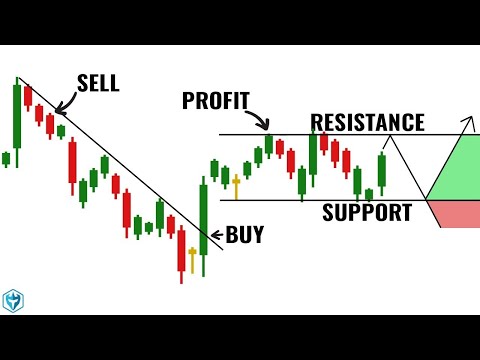
This course is designed to help complete beginners understand candlestick charts and how they are used in trading financial markets. It starts from the very basics, making it perfect for anyone with zero experience in technical analysis.
You will learn what candlesticks are, how they are formed, and what each part of a candle represents, including the body, wicks, and price movements. The course explains how to read bullish and bearish candles and how they reflect market sentiment.
As you progress, you will discover the most important candlestick patterns such as doji, engulfing patterns, hammer, and shooting star. Each pattern is explained in a simple way, along with how traders use them to identify potential market reversals or continuations.
The course also introduces practical strategies for using candlestick charts in real trading scenarios, helping you make better decisions and avoid common beginner mistakes.
By the end of this course, you will be able to read charts confidently, understand price action, and identify trading opportunities using candlestick patterns. This course is ideal for beginners, forex traders, crypto traders, and anyone interested in learning technical analysis from scratch.


